
A Certificate of Analysis is the single most important document that ships with a research peptide. It converts a supplier's marketing claim into a measurable, batch-specific number that anyone can verify. Yet many laboratories treat it as paperwork rather than data — and lose the ability to interpret their own experiments as a result.
This guide walks through what HPLC purity actually measures, what the fields on a Certificate of Analysis mean, and why the difference between 95% and ≥99% purity is the difference between clean data and a study that cannot be replicated.
What HPLC measures
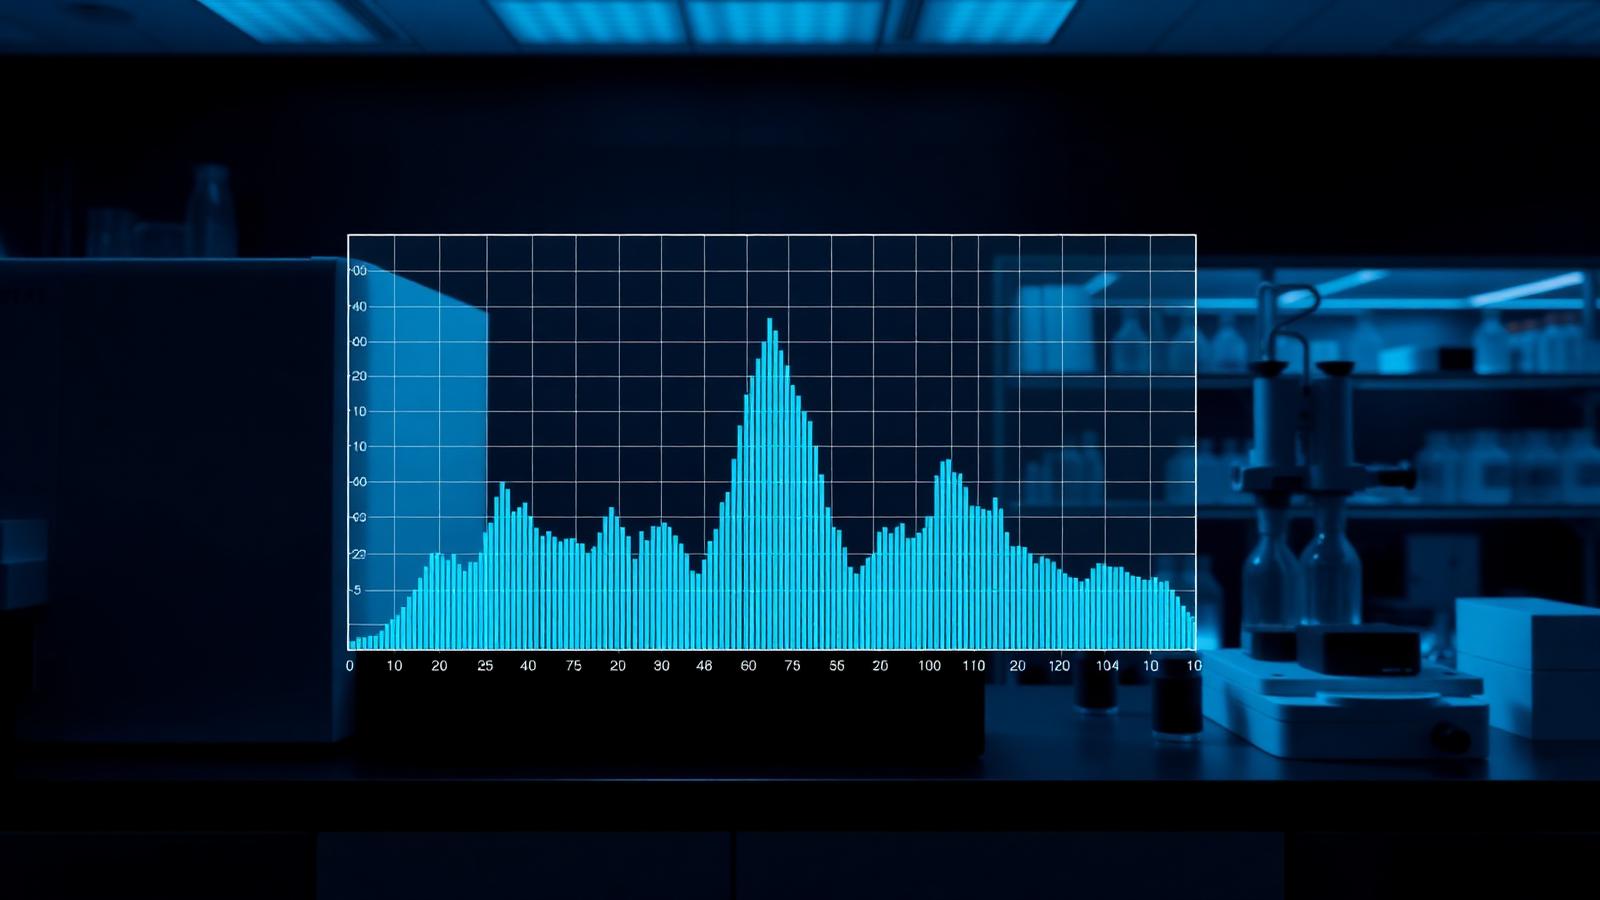
High-performance liquid chromatography separates the components of a sample by pushing them through a column packed with a stationary phase. Different molecules interact with that phase for different lengths of time, so they exit — elute — at different retention times. A UV detector at the column outlet records absorbance, producing the familiar chromatogram of peaks along a time axis.
The area under the target peptide's peak, divided by the total area of all peaks, gives the purity percentage. That is the number reported on the Certificate of Analysis. A single tall peak with a flat baseline is what ≥99% purity looks like.
Reading a Certificate of Analysis
A well-prepared COA contains, at minimum, the following fields:
- Product name and molecular formula, so you can confirm you received the correct compound.
- Batch or lot number, letting you tie the analysis to the specific vial in your hand.
- HPLC purity percentage, usually reported to one decimal (e.g. 99.4%).
- Retention time and column conditions, so a second lab could reproduce the analysis.
- Mass spectrometry data confirming the peptide's molecular weight matches the theoretical value.
- Appearance (colour, physical form), test method, and quality-control signature or reference.
Why 95% is not "almost 99%"
The gap between 95% and 99% purity is not a linear four percentage points. It is a fourfold difference in impurity load — 5% versus 1% — and those impurities are not inert filler. They are, almost by definition, molecules structurally similar to the target peptide: truncated sequences, deletion peptides, and side-reaction adducts.
In a receptor binding assay those look-alike impurities compete for the same binding pocket, distorting IC50 values. In cell-based work they add background signalling at concentrations high enough to move the mean. The effect is small enough that any single experiment still "works" — and large enough that no two batches replicate cleanly.
The ≥99% threshold matters most in three scenarios
- Dose-response studies, where impurities skew the low-dose baseline.
- Comparative work across batches, where lot-to-lot impurity variation becomes systematic error.
- Long-duration protocols, where accumulated impurities are more likely to hit secondary targets.
Beyond purity: what else the COA tells you
A complete COA also reports water content, acetate or trifluoroacetate counter-ion content, and residual solvent levels. All three change the effective peptide mass in a reconstituted stock: a vial labelled 10 mg can contain 8.5 mg of peptide once water and counter-ion are accounted for. Serious quantitative work uses net peptide content, not gross vial mass.
How Alveon handles quality control
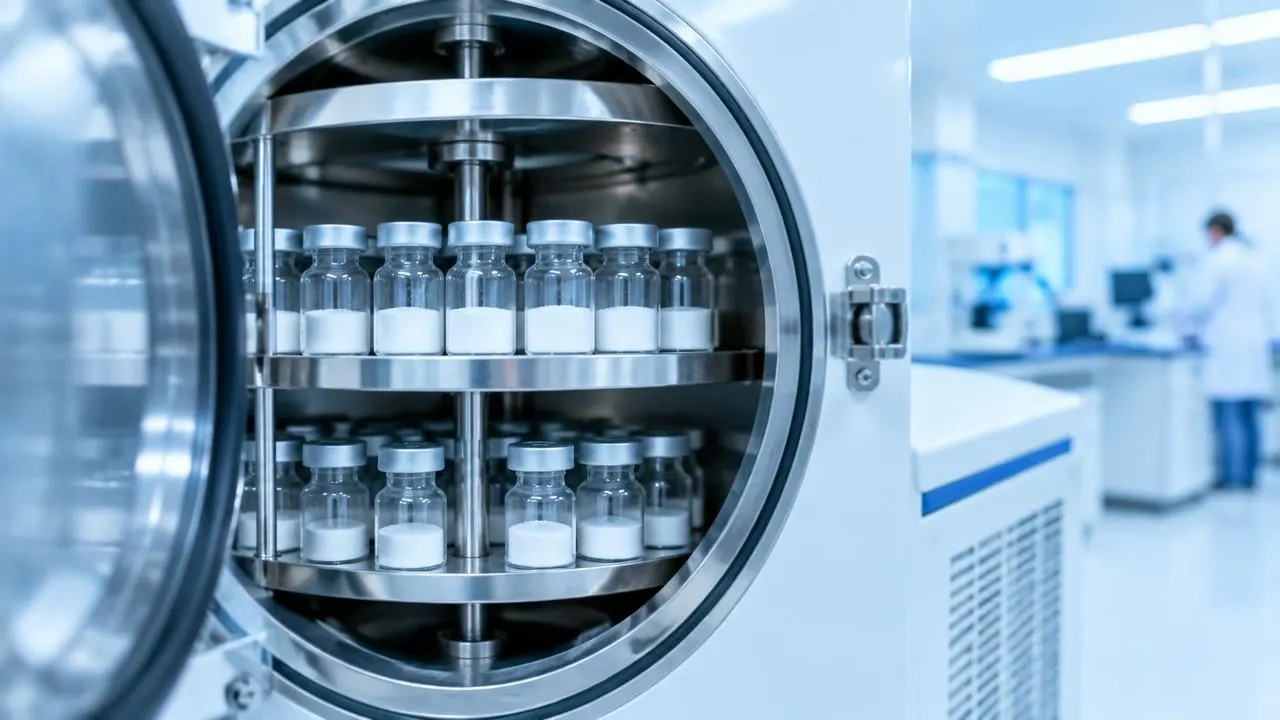
Every Alveon batch is analysed by reverse-phase HPLC and verified by mass spectrometry before release. Purity is reported to one decimal and must meet ≥99% to leave the facility. The batch-specific COA is available on request for every vial shipped, and lot numbers are tracked through fulfilment so a researcher can always tie the paperwork to the physical material in the fridge.